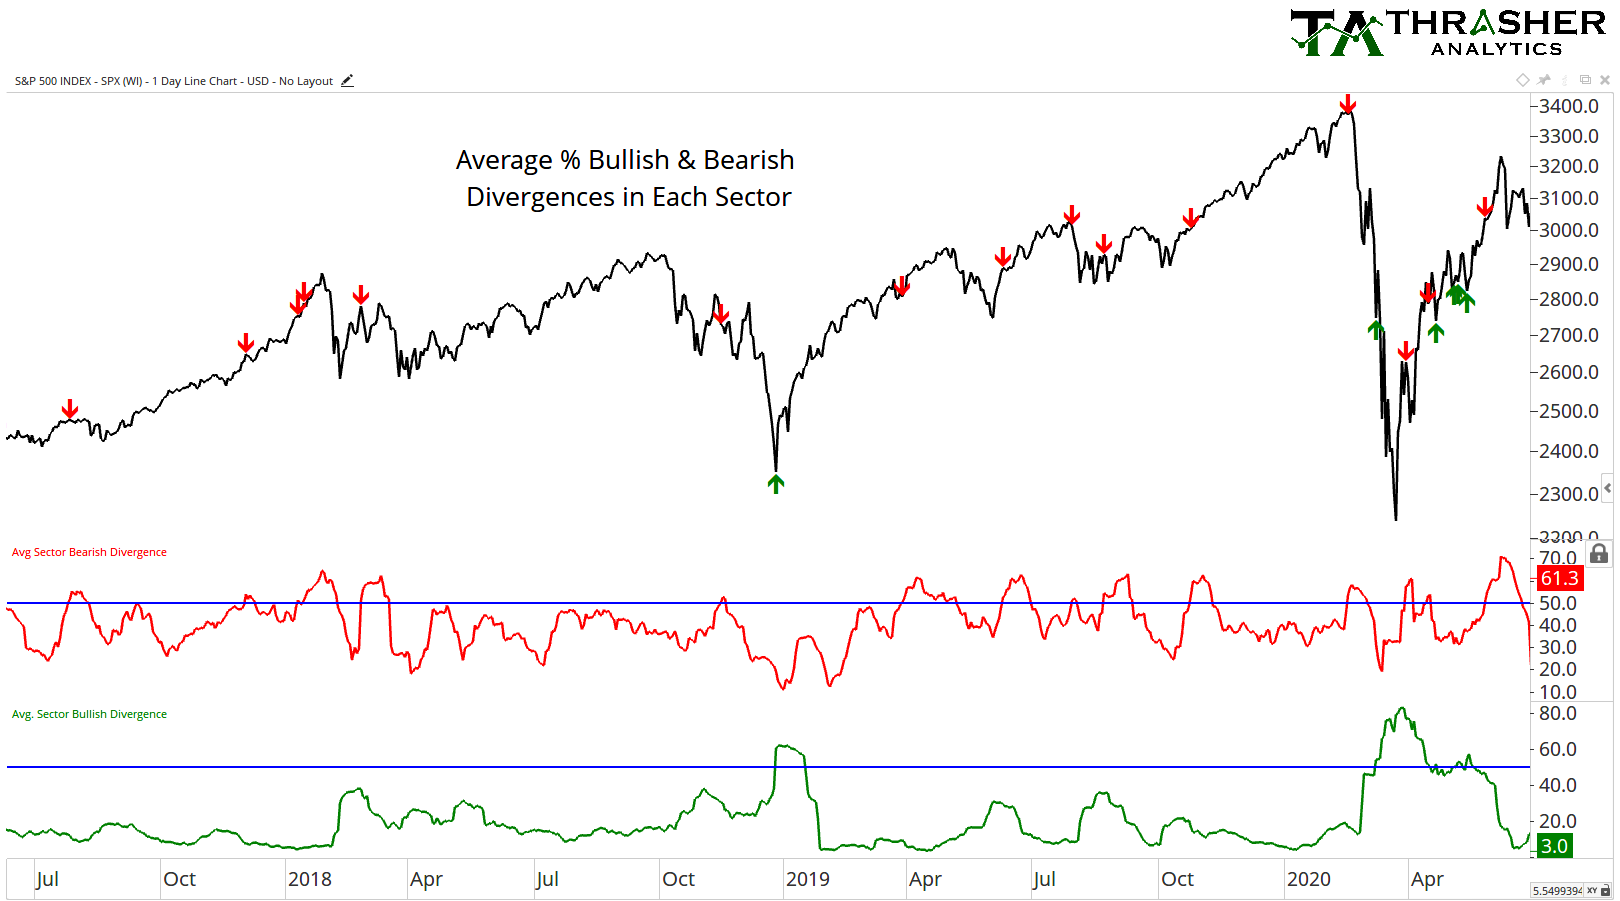
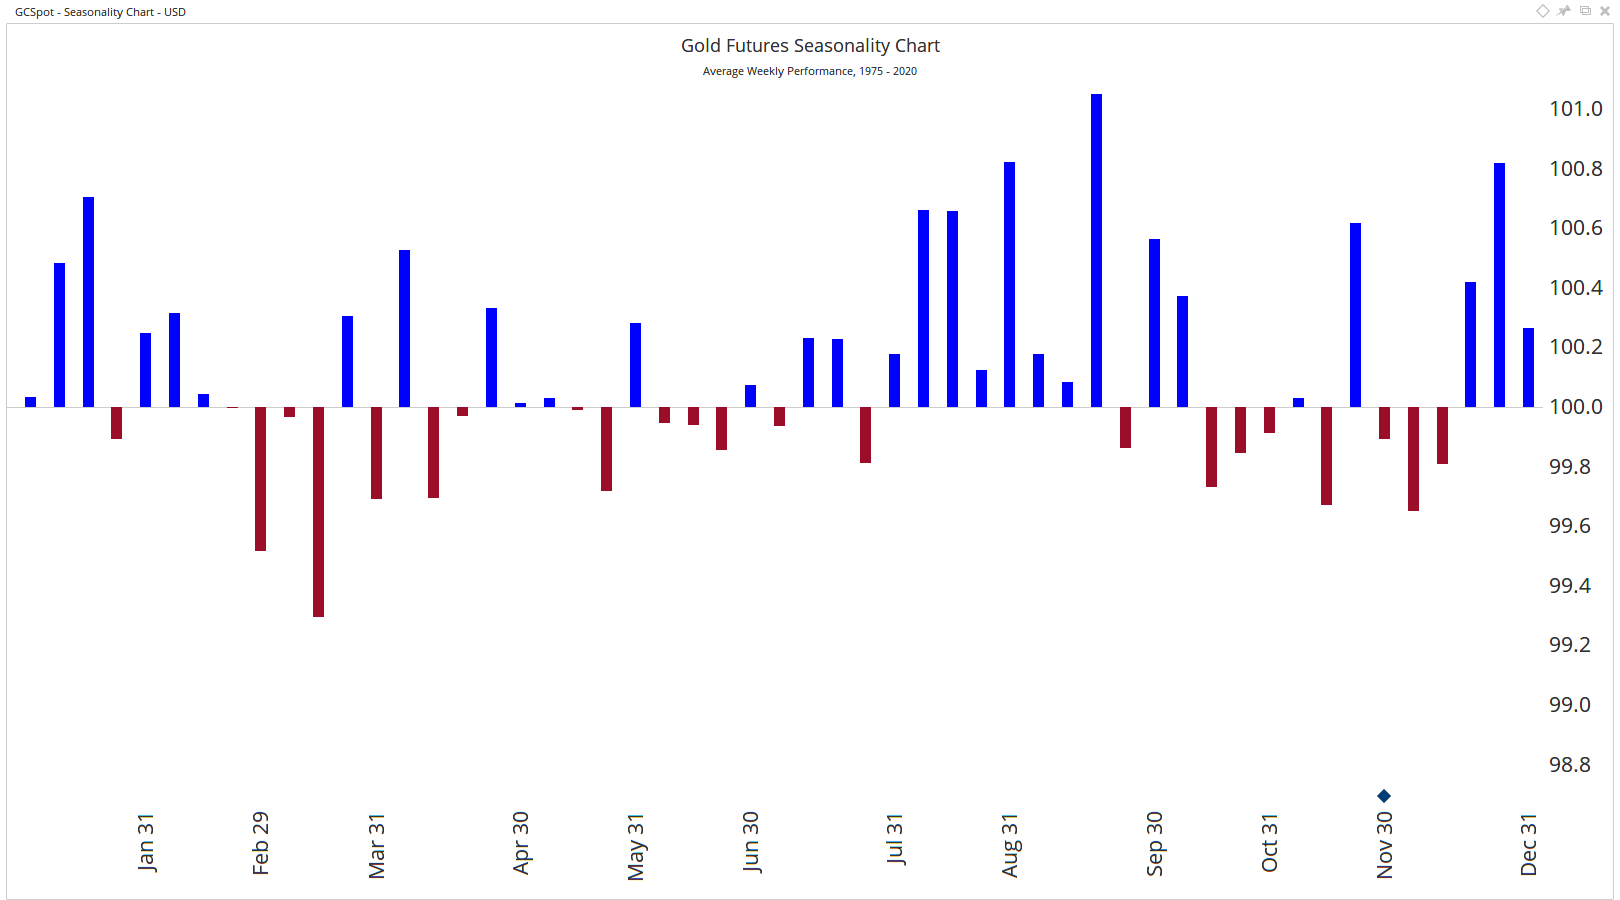
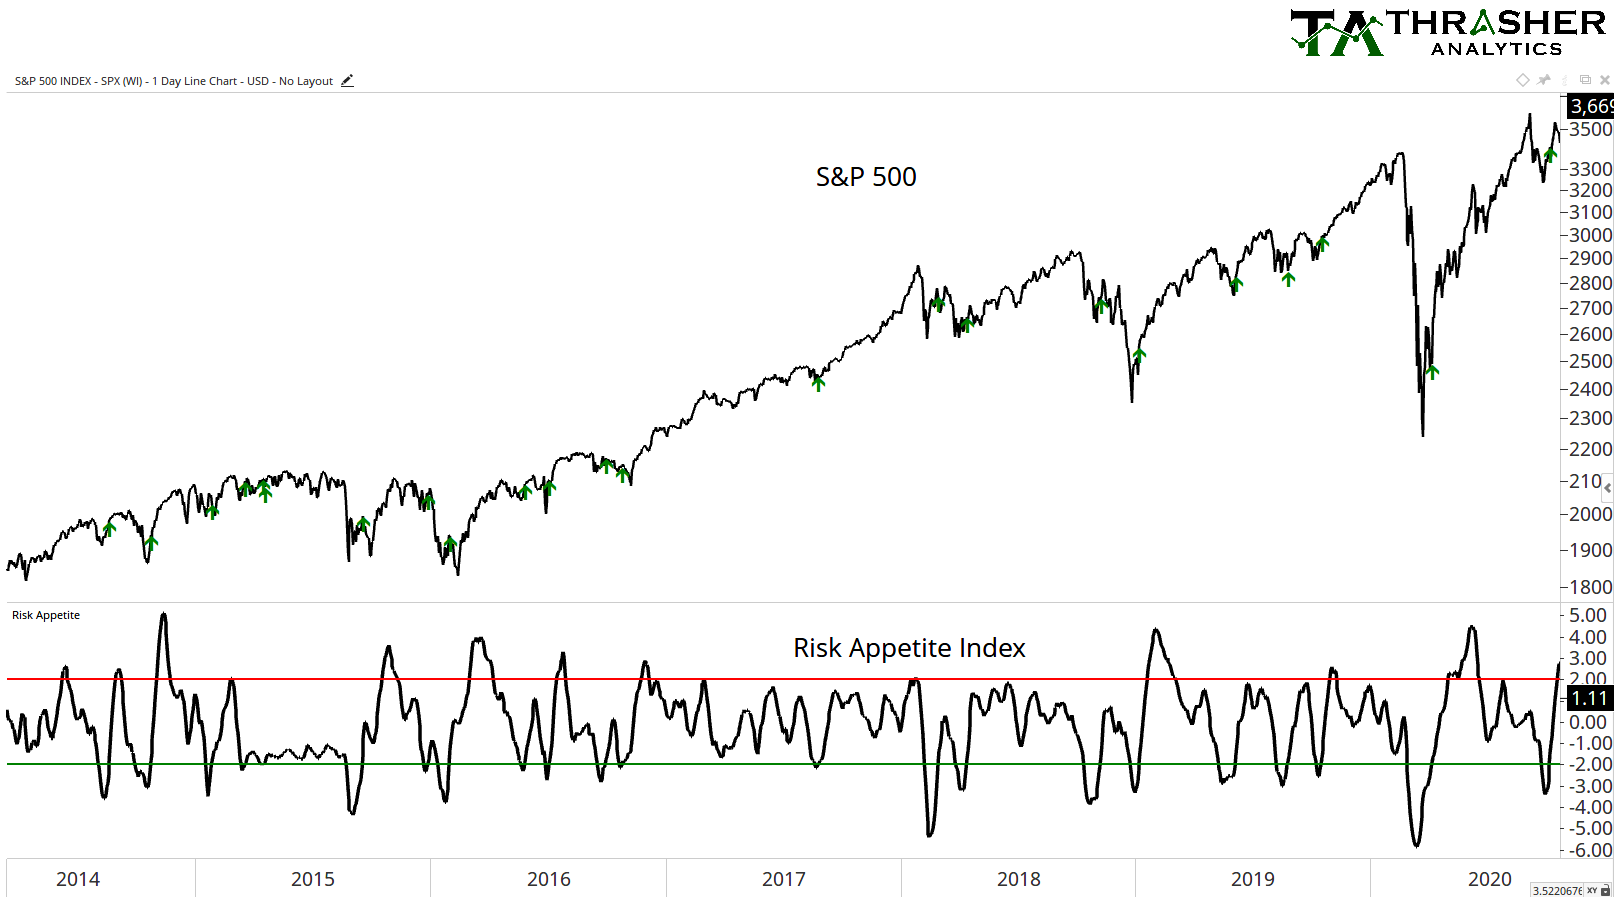
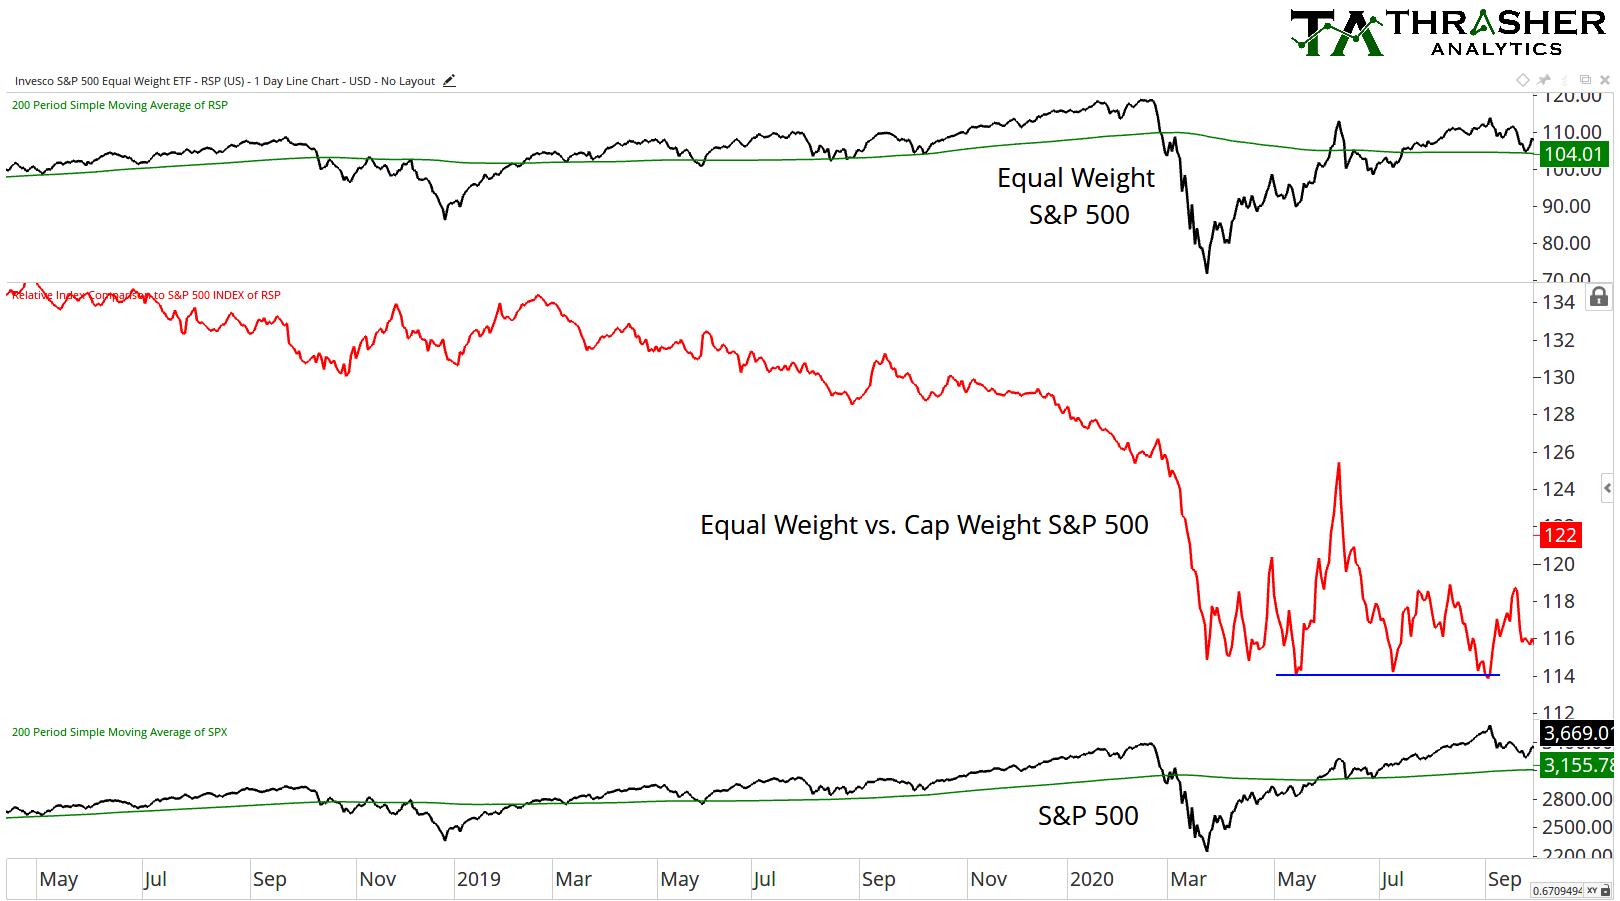
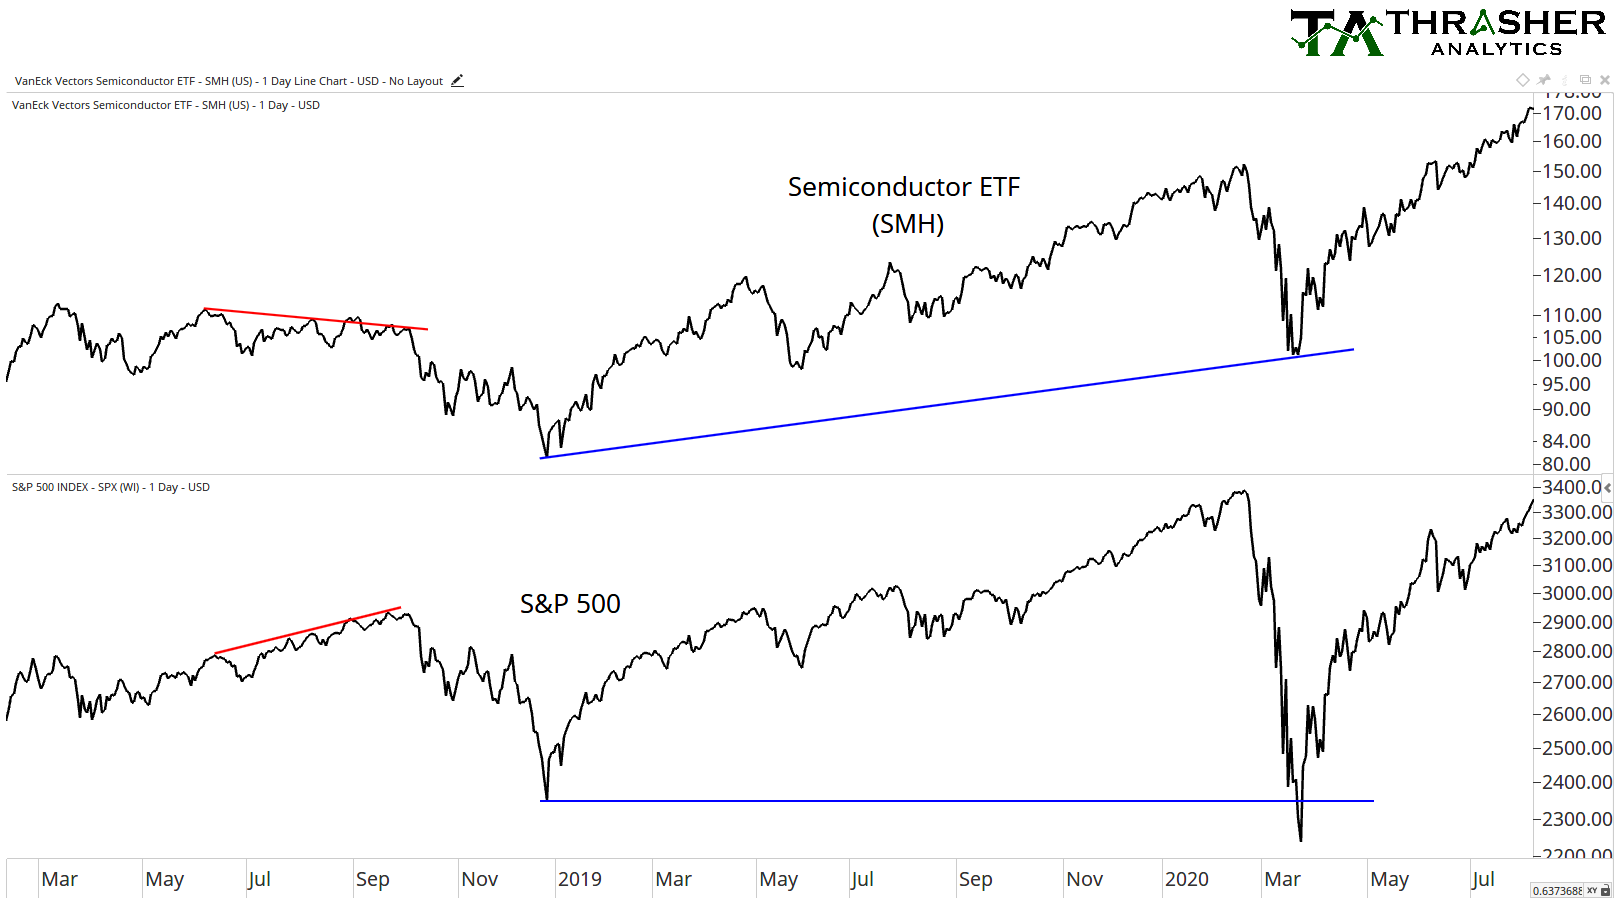
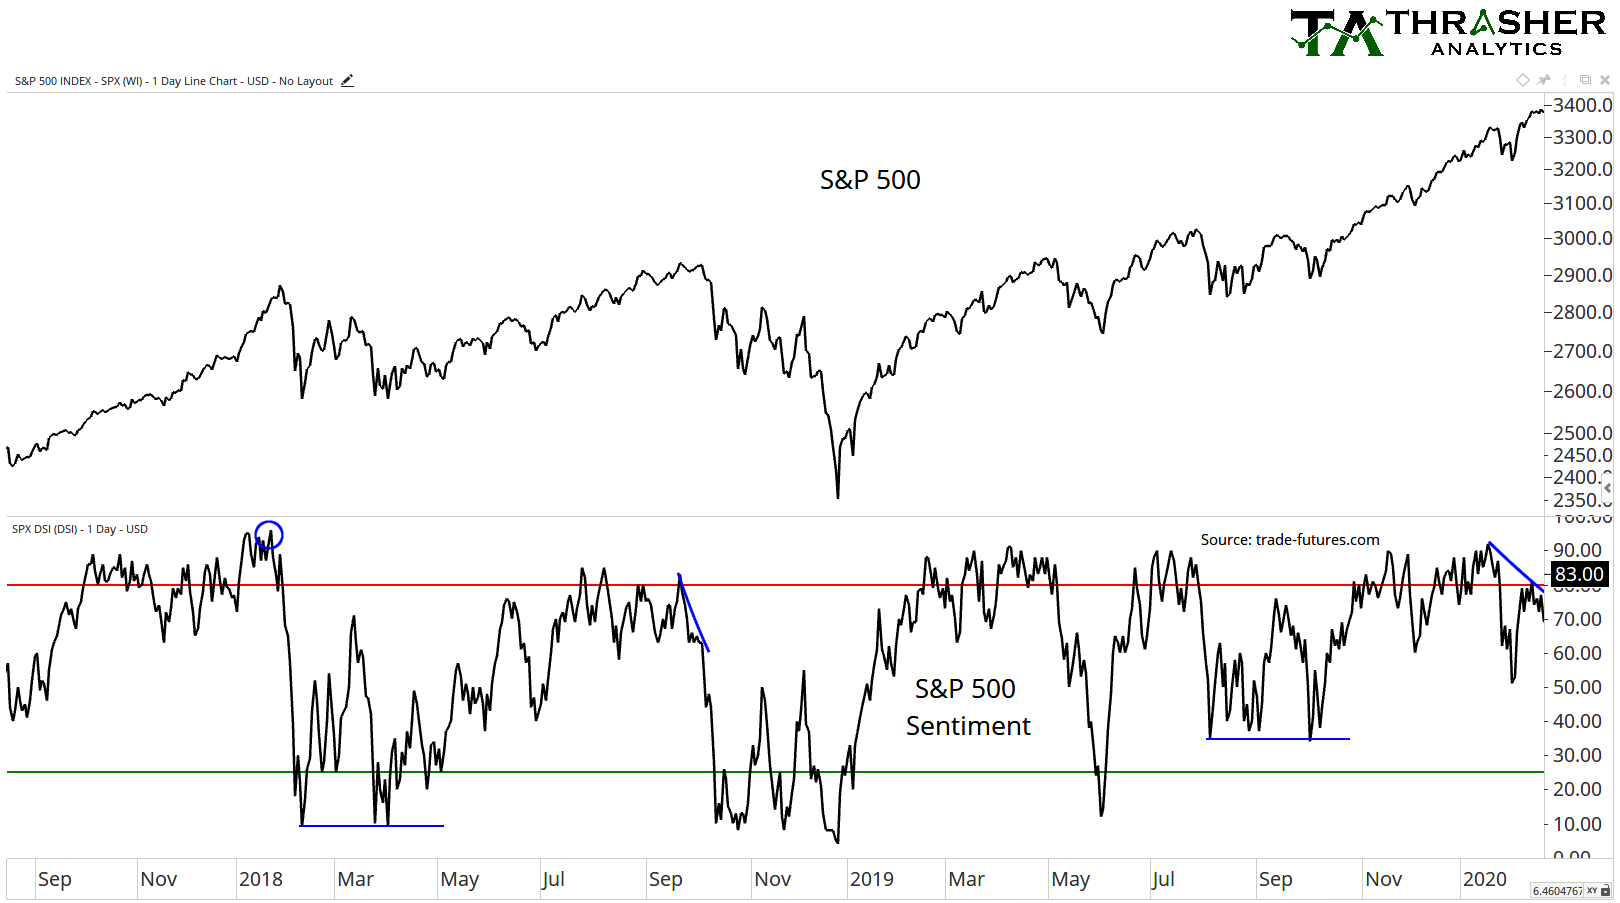
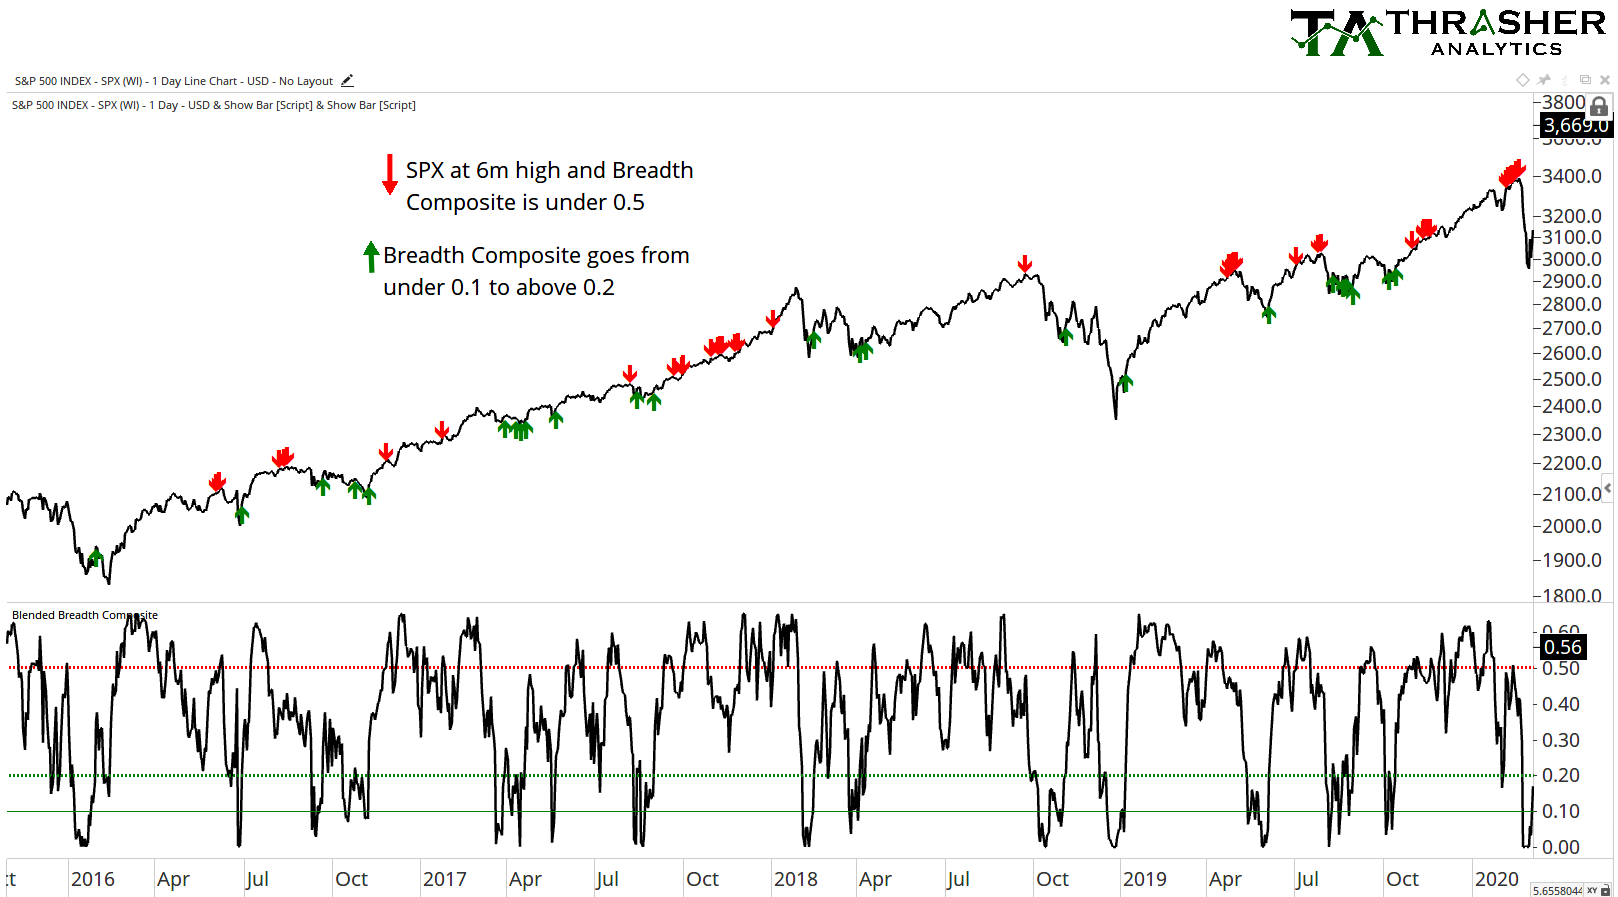
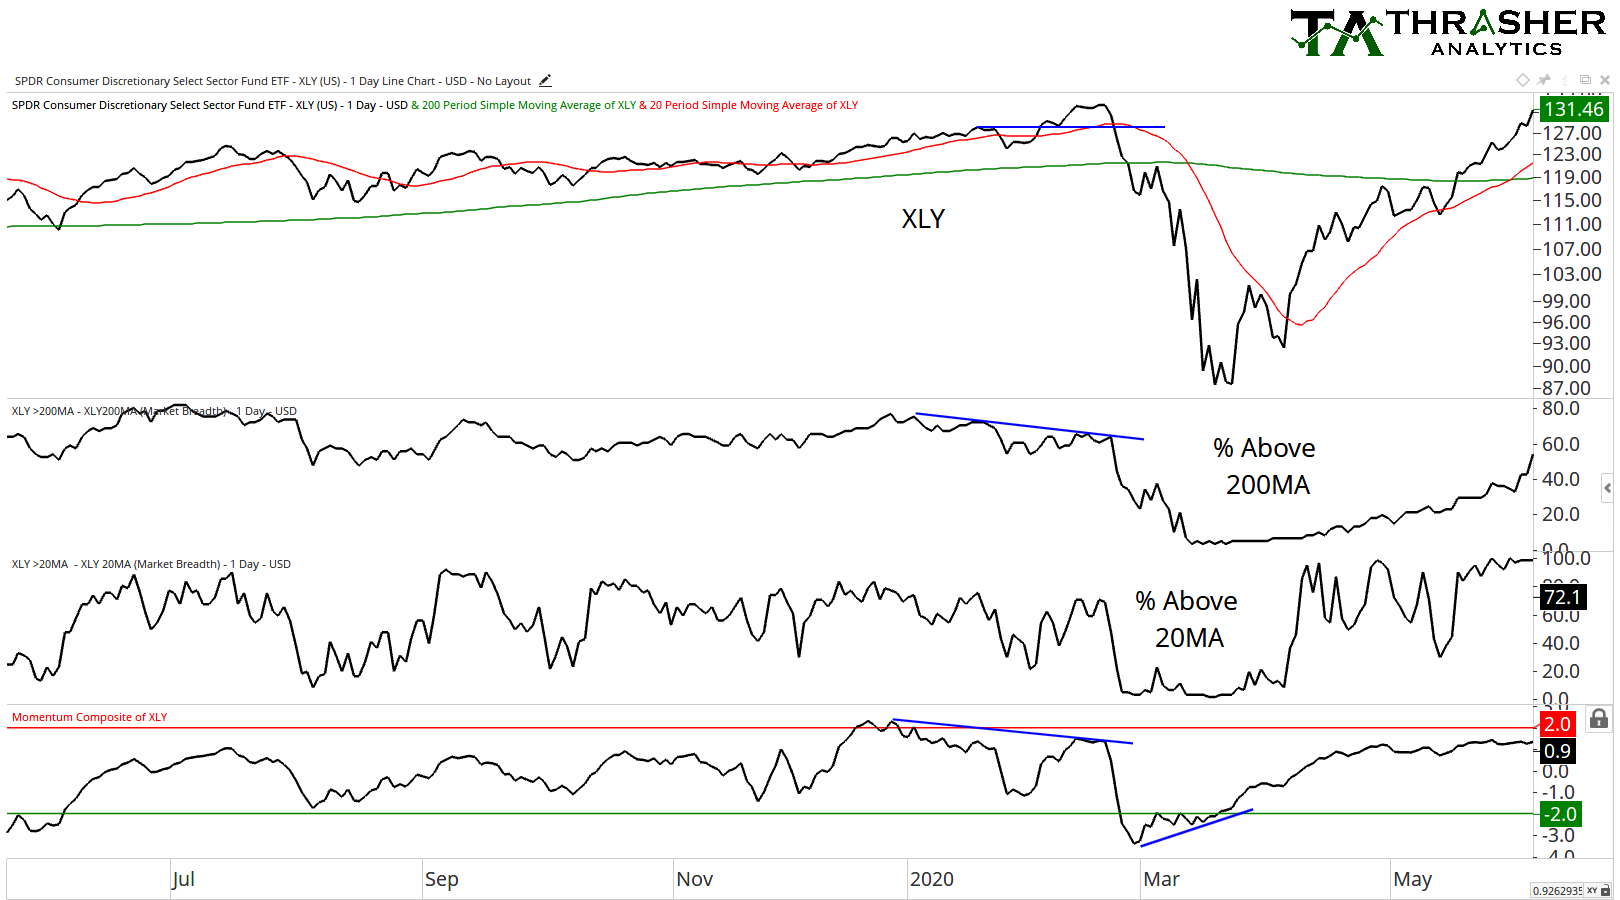
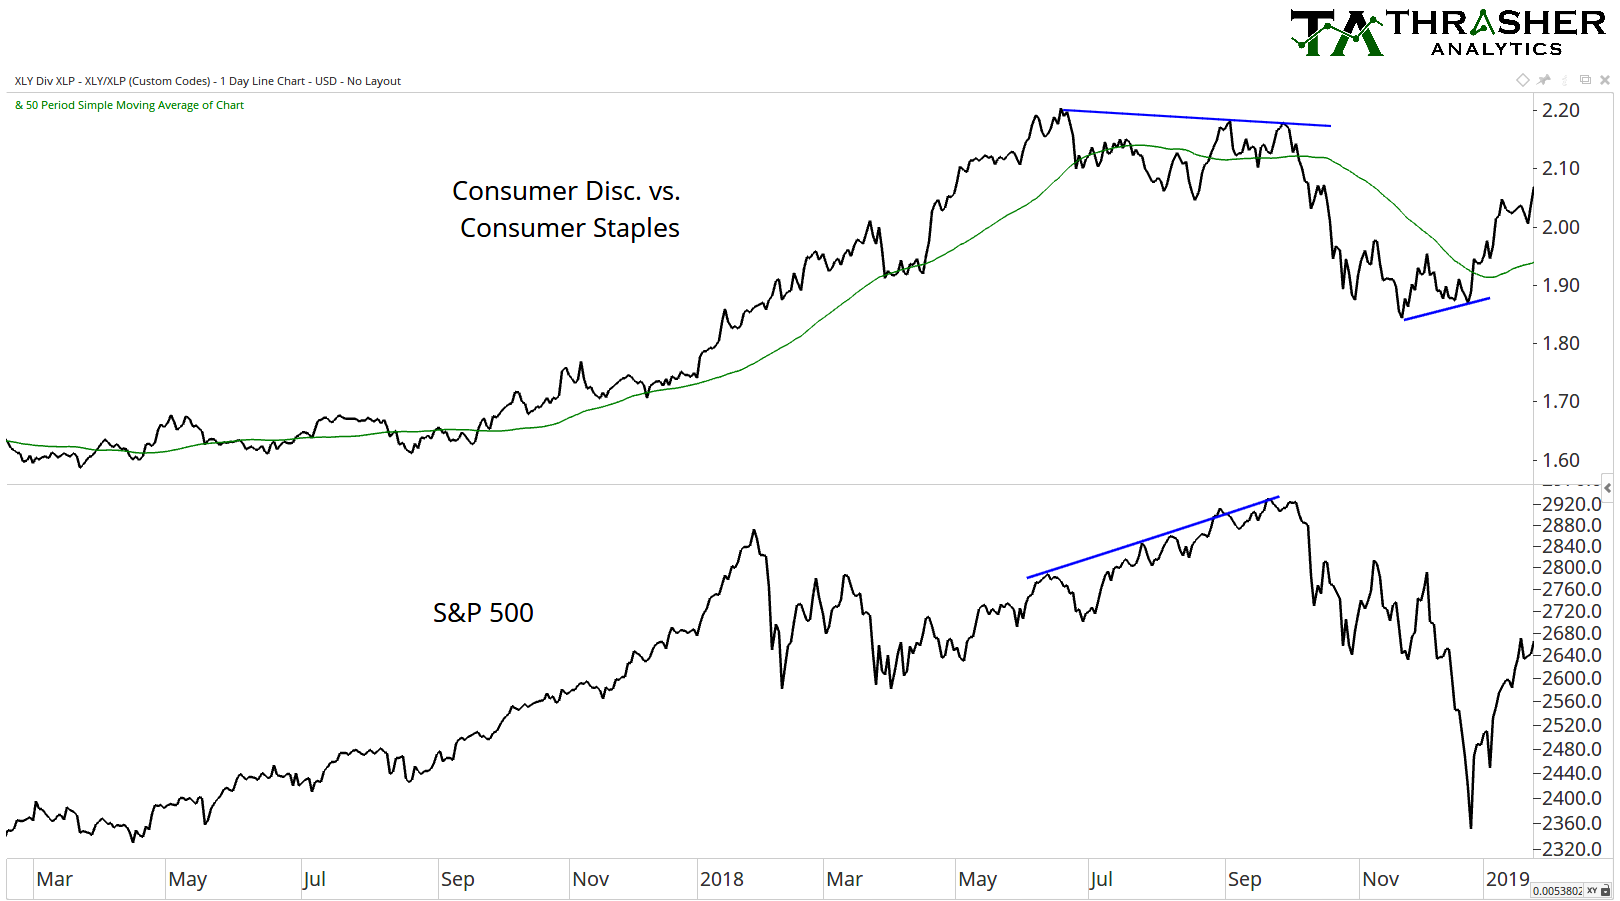
The primary offering of Thrasher Analytics is our email newsletter, sent every Sunday evening, that provides subscribers with an update on the trend and sector rotation models, Market Health Report, breadth statistics and sentiment data as well as in-depth analysis market developments, opportunities, and risks. Many of the charts we share within the letter are based on custom built indicators that aren’t provided by any other research firm or analyst. From our proprietary quantitative divergence tools, volatility-adjusted momentum indicators, risk appetite indices, and economic models, we provide subscribers with insights that go above the traditional analysis found on The Street.
We also provide a look at the U.S. sectors and fixed income market through two proprietary systematic re-balancing models. Each newsletter also provides detailed chart analysis for various financial markets, including fixed income, U.S. and international indices, commodities, as well as other important charts we believe subscribers will find valuable. Analysis of trend, breadth, and proprietary gauges of mean-reversion are conducted for each of the 11 U.S. sectors. Its our belief that price action is primary driven by investor sentiment, which is why our commentary includes unique sentiment analysis on the futures market. Finally, we also include an update on the Volatility Risk Trigger (VRT), VIX Top Signals, Market Health Report, and other important volatility-related data and indicators.
Volatility Risk Trigger & VIX Top Signal
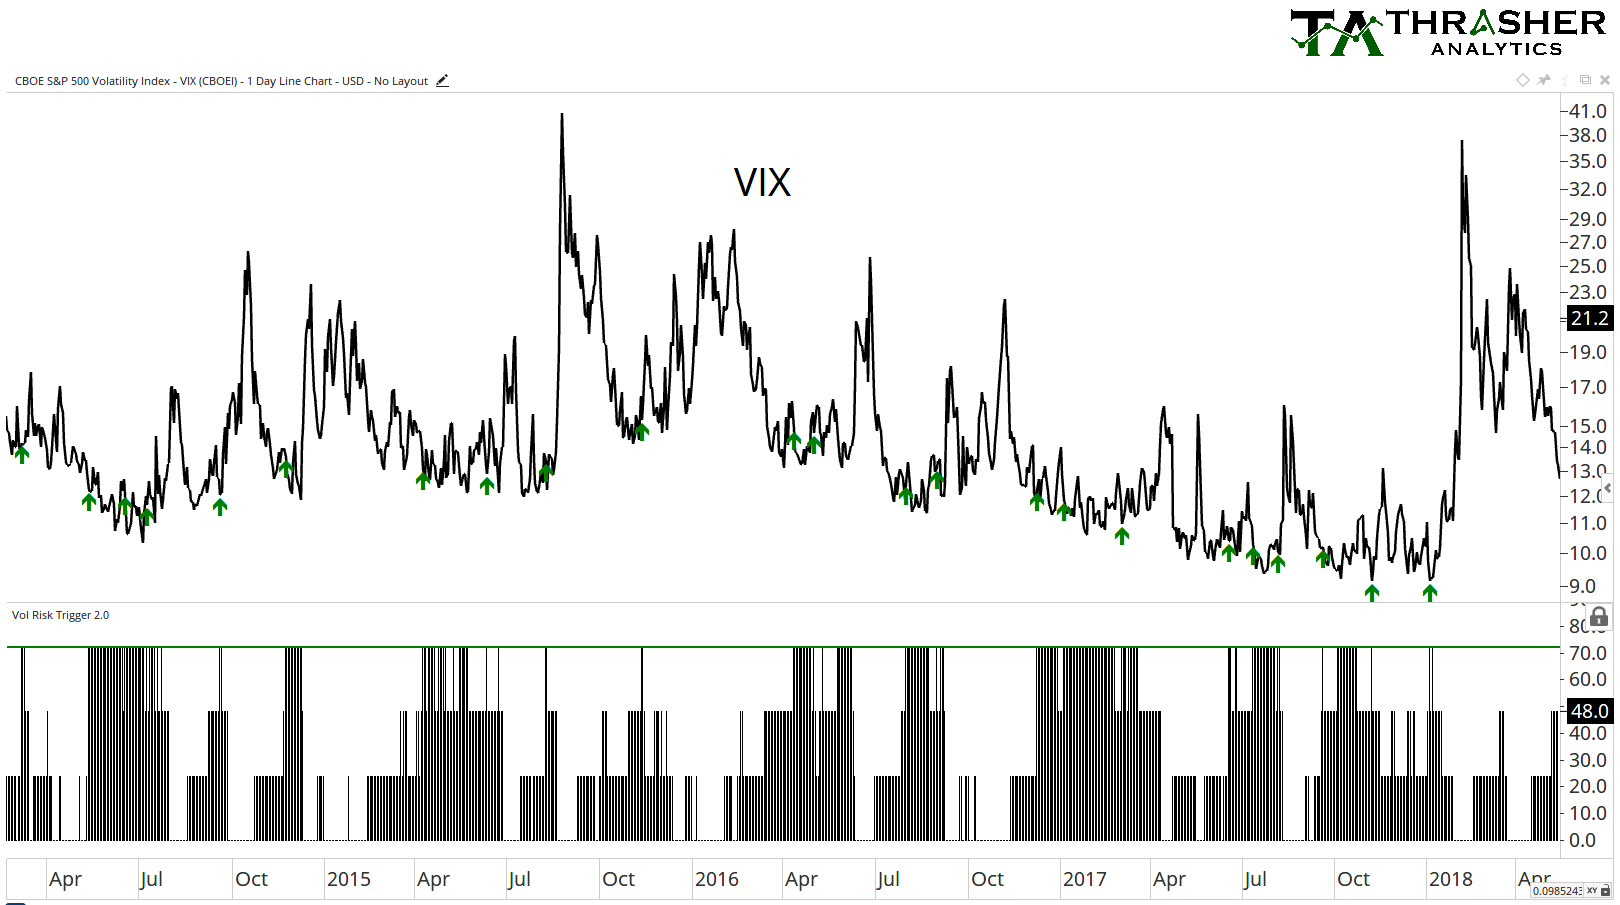
The Volatility Risk Trigger (VRT) was developed by Andrew Thrasher, CMT and is a continuation from the research he conducted for his Charles H. Dow Award winning paper on market volatility. Mr. Thrasher found that there are several market-based “symptoms” that have often preceded large swings within the Volatility Index (VIX), which work as a composite within the VRT. The VRT is an adaptive system that is designed to uncover high-probability periods that lead to bottoms in volatility and are followed by large moves higher in the VIX.
While the VRT is not intended to be a trading system by itself, subscribers of Thrasher Analytics use the VRT as an early warning signal that can be incorporated into their own portfolio management process. That may involve protection of investment capital from potential equity market weakness or attempting to generate alpha from the forecasted rise in the Volatility Index.
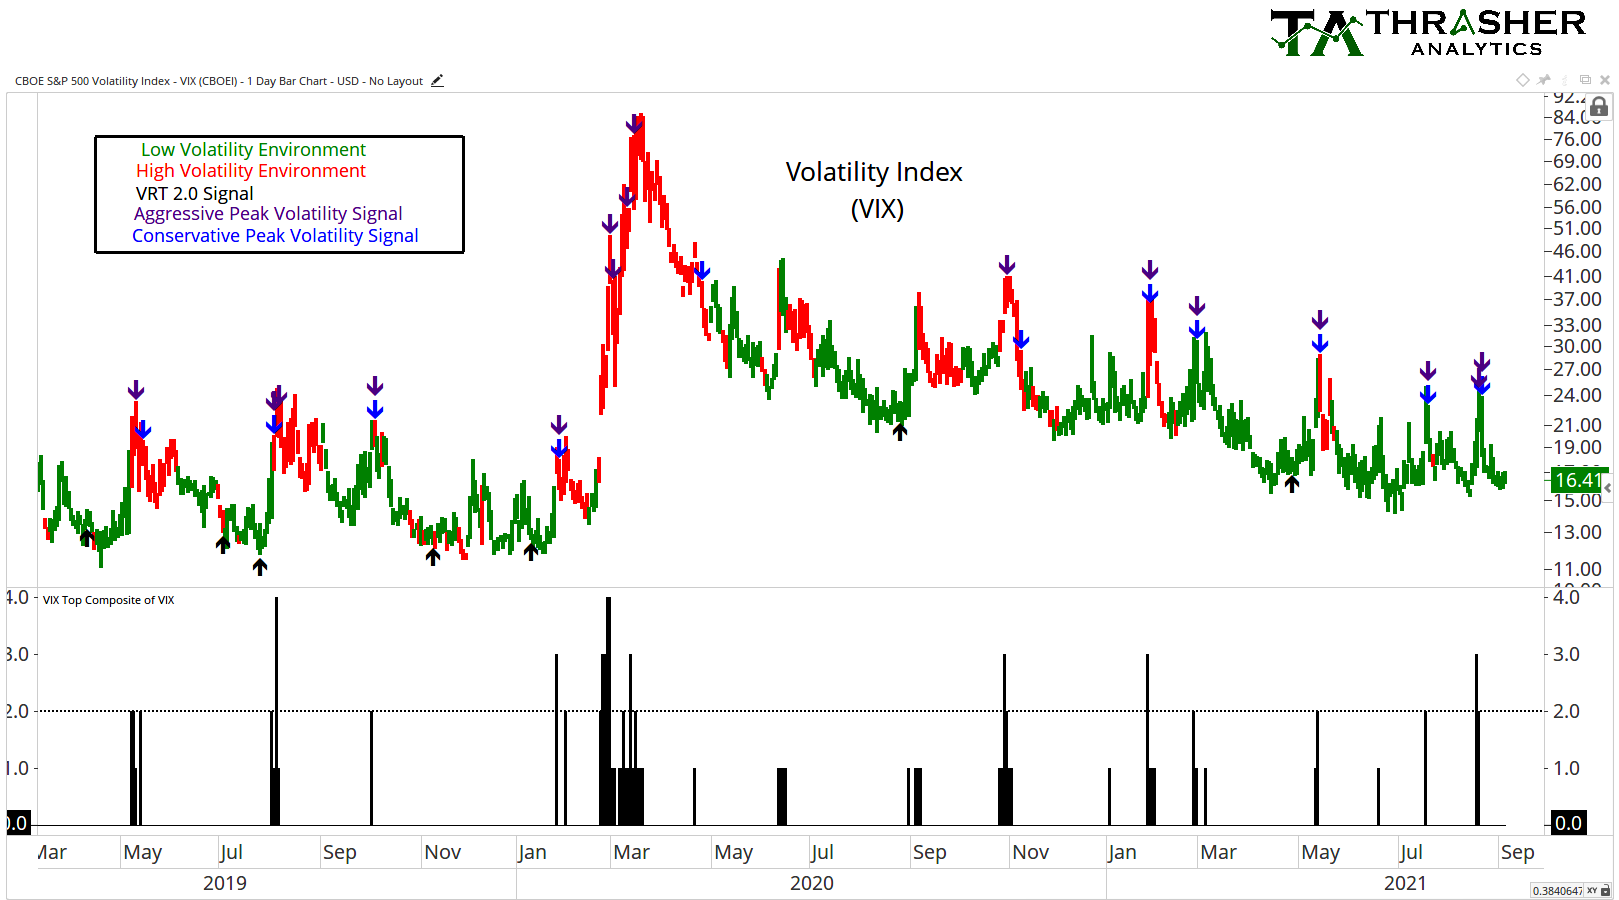
The time between signals generated from the Volatility Risk Trigger can obviously vary, however each year typically sees several periods of substantial increases in the VIX, which are often preceded by alerts generated by the VRT. Just like the importance of being prepared for a rain storm by having an umbrella, investors can better prepare themselves for periods of high volatility by having access to the signals generated by the Volatility Risk Trigger.
To work in conjunction with VRT are two types of VIX Top Signals. Like the VRT, these signals are based entirely on financial market data and provide insight into when there’s a high probability that volatility will move lower.
Market Health Report
One of the goals of Thrasher Analytics is to provide a unique insight into the markets from different vantage points. To accomplish this, custom built indicators and data sets are used, giving subscribers an edge over the other market participants. While each distinctive view is useful, putting it all together into a single market signal can, at times, be difficult. For instance, if there is a build up in bullish momentum divergences, and improving breadth, but sentiment and volatility are bearish – what’s the ultimate takeaway? That’s the question I believe gets answered with the Thrasher Analytics Market Health Report.
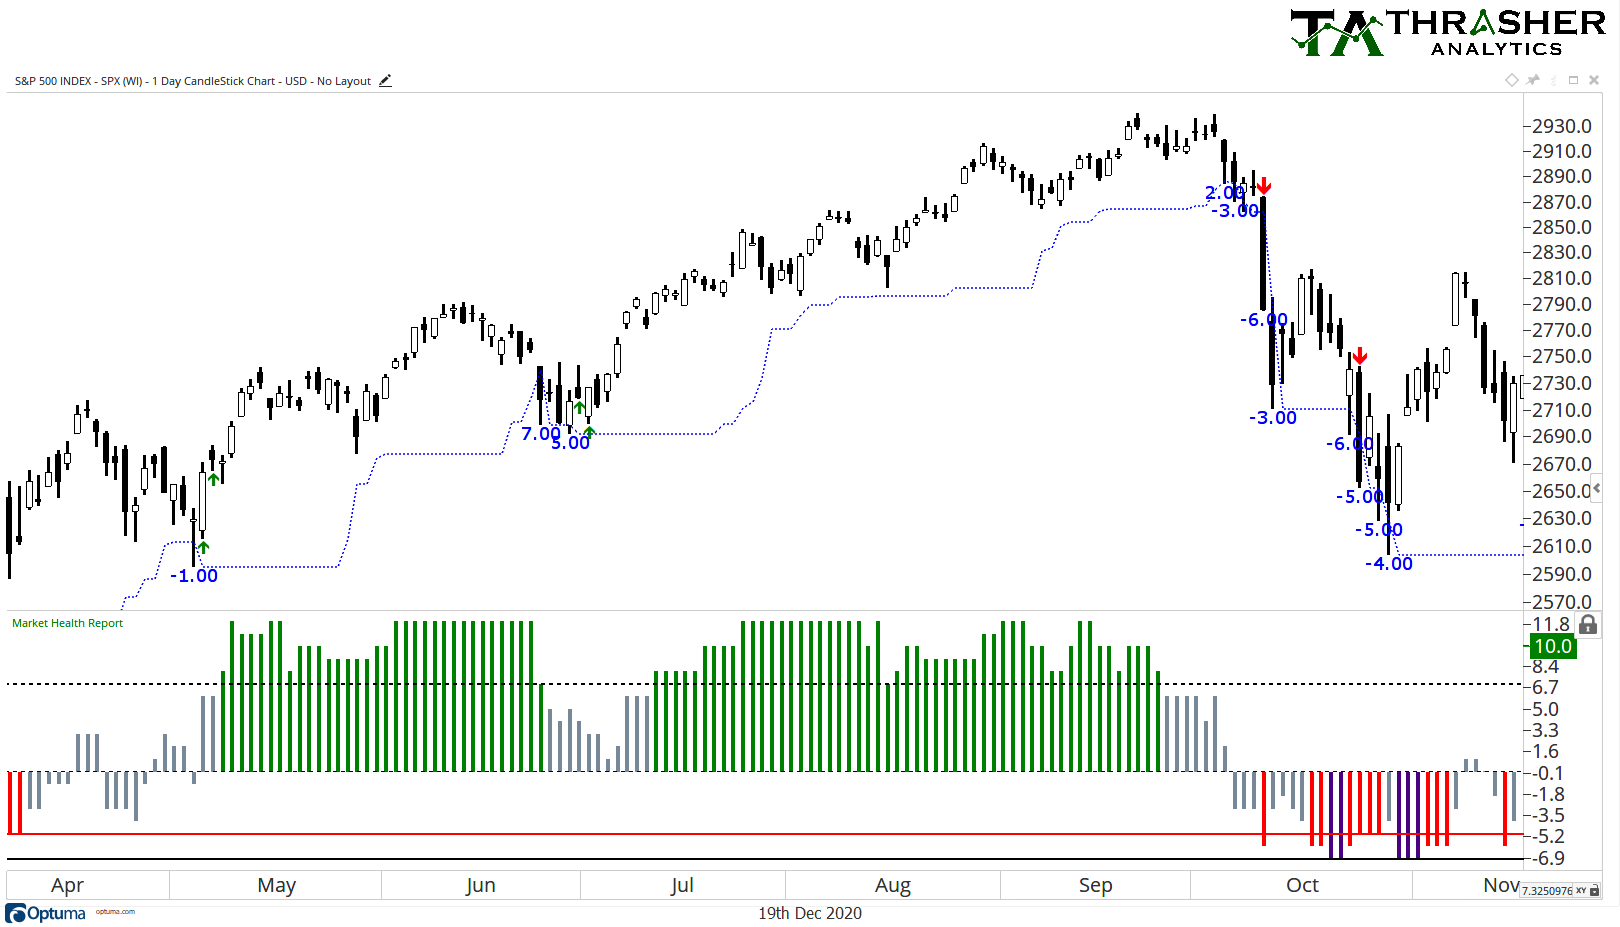
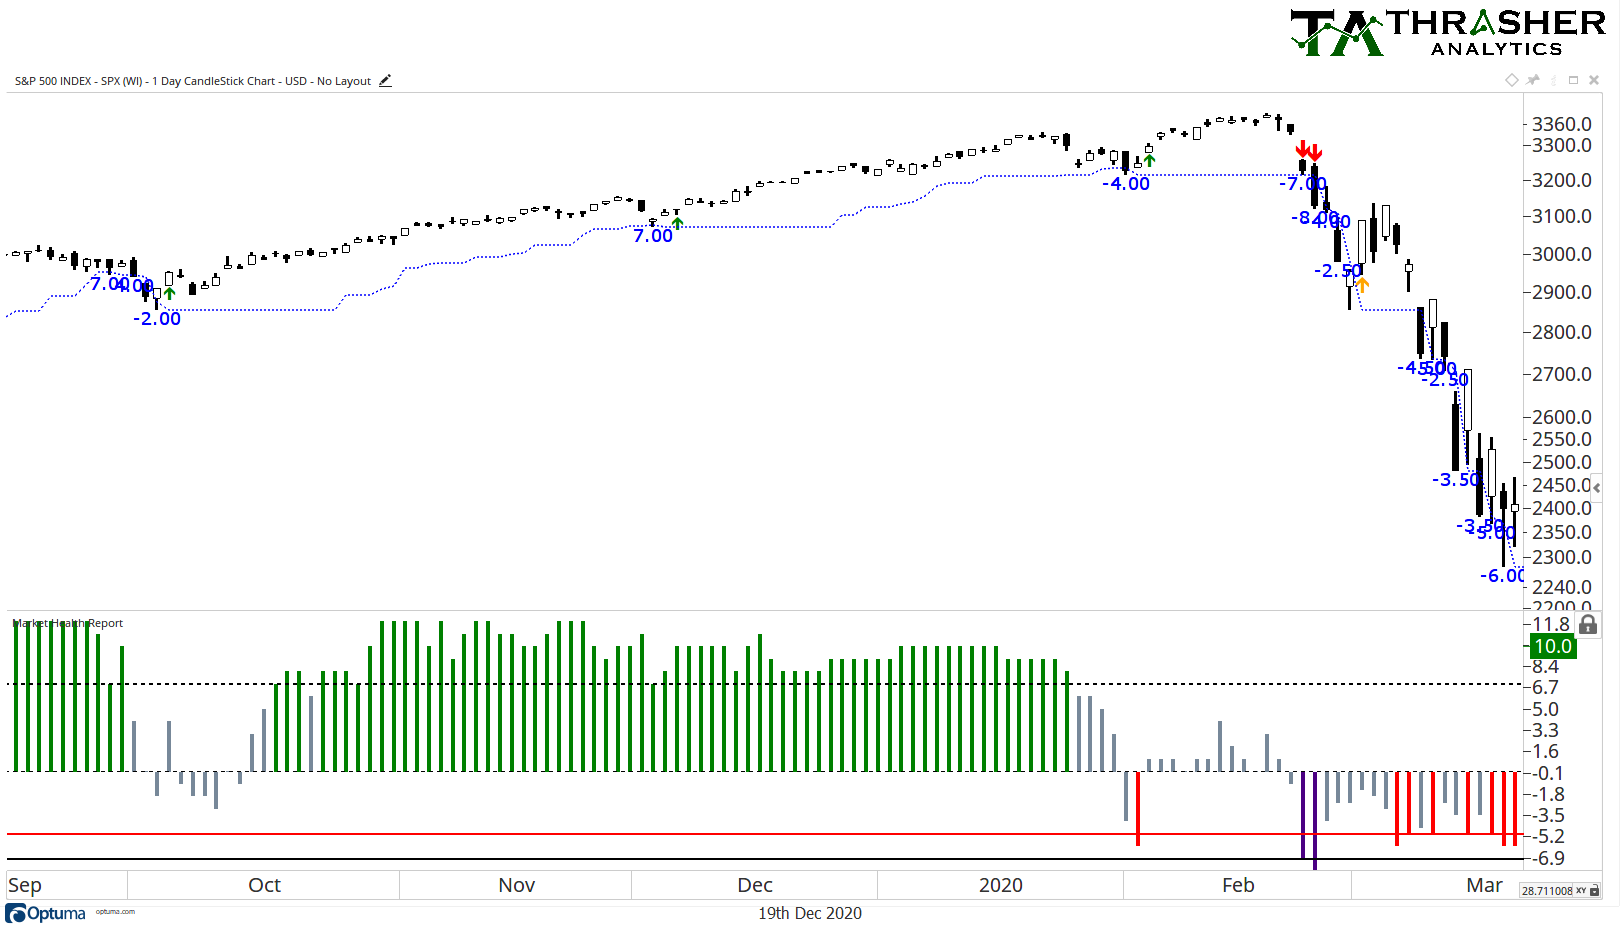
The Market Health Reports (MHR) incorporates breadth, sentiment, bullish/bearish divergences, volatility, trend, and momentum into a single composite. This tool is not intended to predict the market, call tops or bottoms or pinpoint short-term wiggles in the S&P 500 or a single stock. Instead, it tells a story of the health of the underlying market at critical junctures. Rather than be used to signal market peaks and bottoms, the Market Health Report’s goal is to identify periods in the market where selling is likely to continue and be just a brief dip. Just like you would not go to the doctor for a check-up every day, we don’t need to concern ourselves with the MHR every tick of the S&P 500. Instead, we focus on the Health Report when the market has weakened to a specific degree.
Is the Market Health Report the end-all-be-all market indicator? Absolutely not. It’s our way of taking the proverbial temperature of the market to determine if it has just a head cold, so to speak, or something much more serious. There will of course be periods where the MHR gets it wrong, nothing is perfect. But by being a systematic process of evaluating the health of a market after short declines in price we can objectively attempt to understand if the underlying market dynamics remain supportive of a bullish trend or suggest further weakness could emerge.
Technical Analysis
Thrasher Analytics provides a detailed review of the broad technical themes taking place in the financial markets, both domestic and international. With a focus on the major U.S. sectors and industries, our analysis gives readers a better understanding of the supply and demand forces driving trends in price. Using custom built tools, indices, and indicators our analysis offers an extremely unique view into the market not found anywhere else.
A deep understanding of technical terms or chart reading is not necessary or required of readers, as each chart summary provides simple-to-understand language and descriptions. With a belief in keeping analysis simple, our charts and analysis are not overloaded with a multitude of indicators and confusing lines – we strive to allow the underlying price to be take the leading role in our review.
Adaptive Trend Model
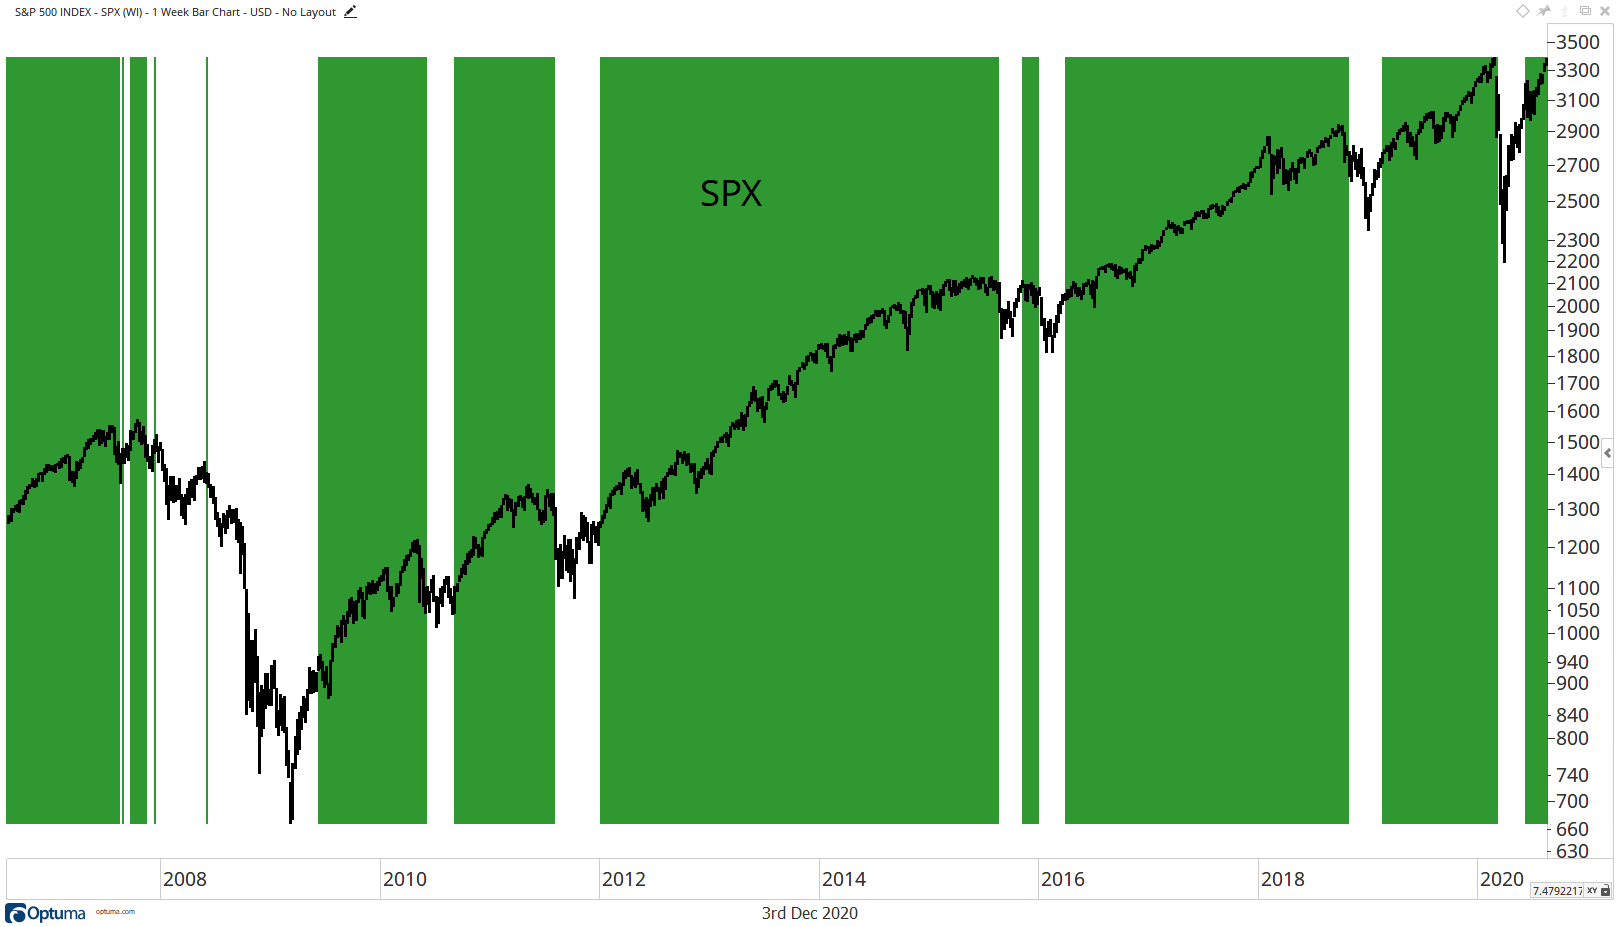
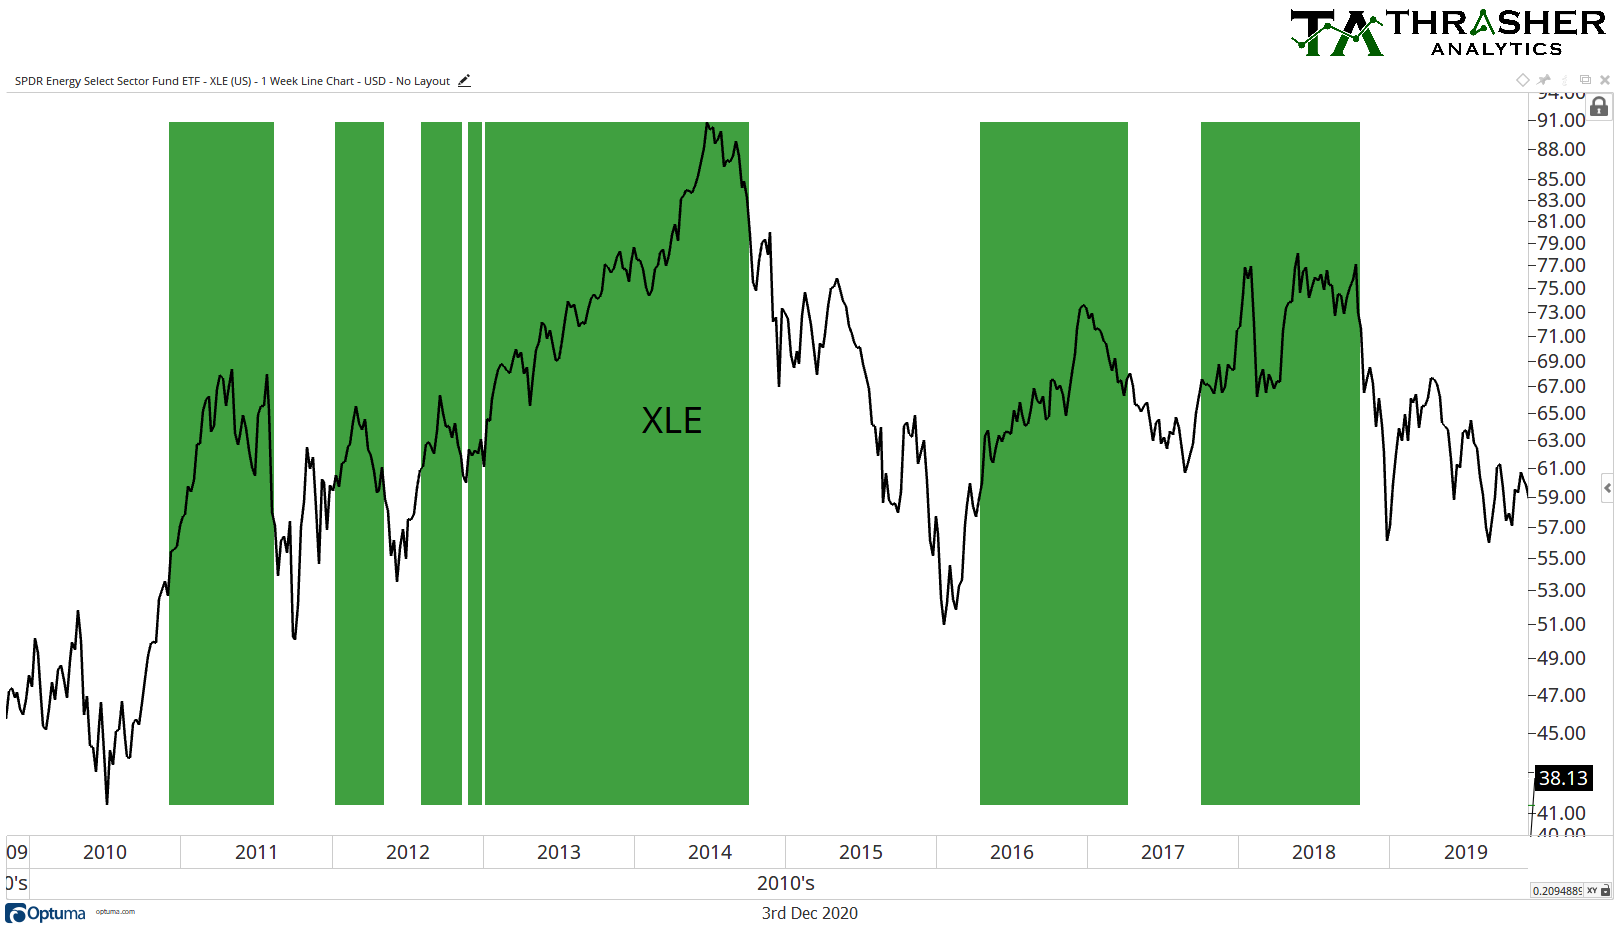
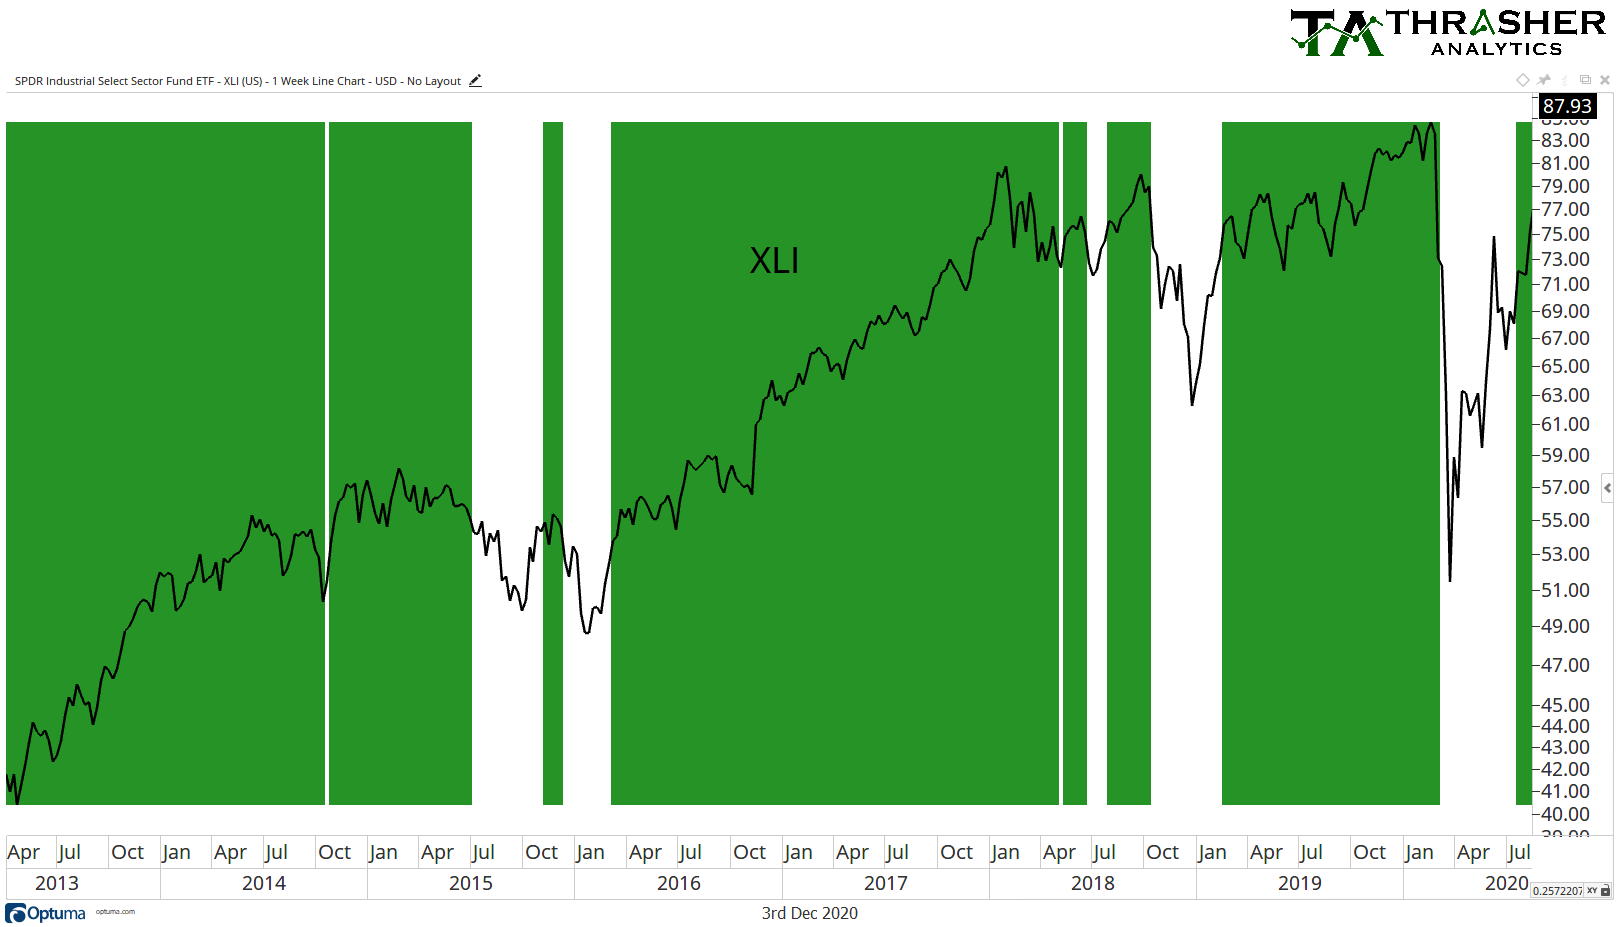
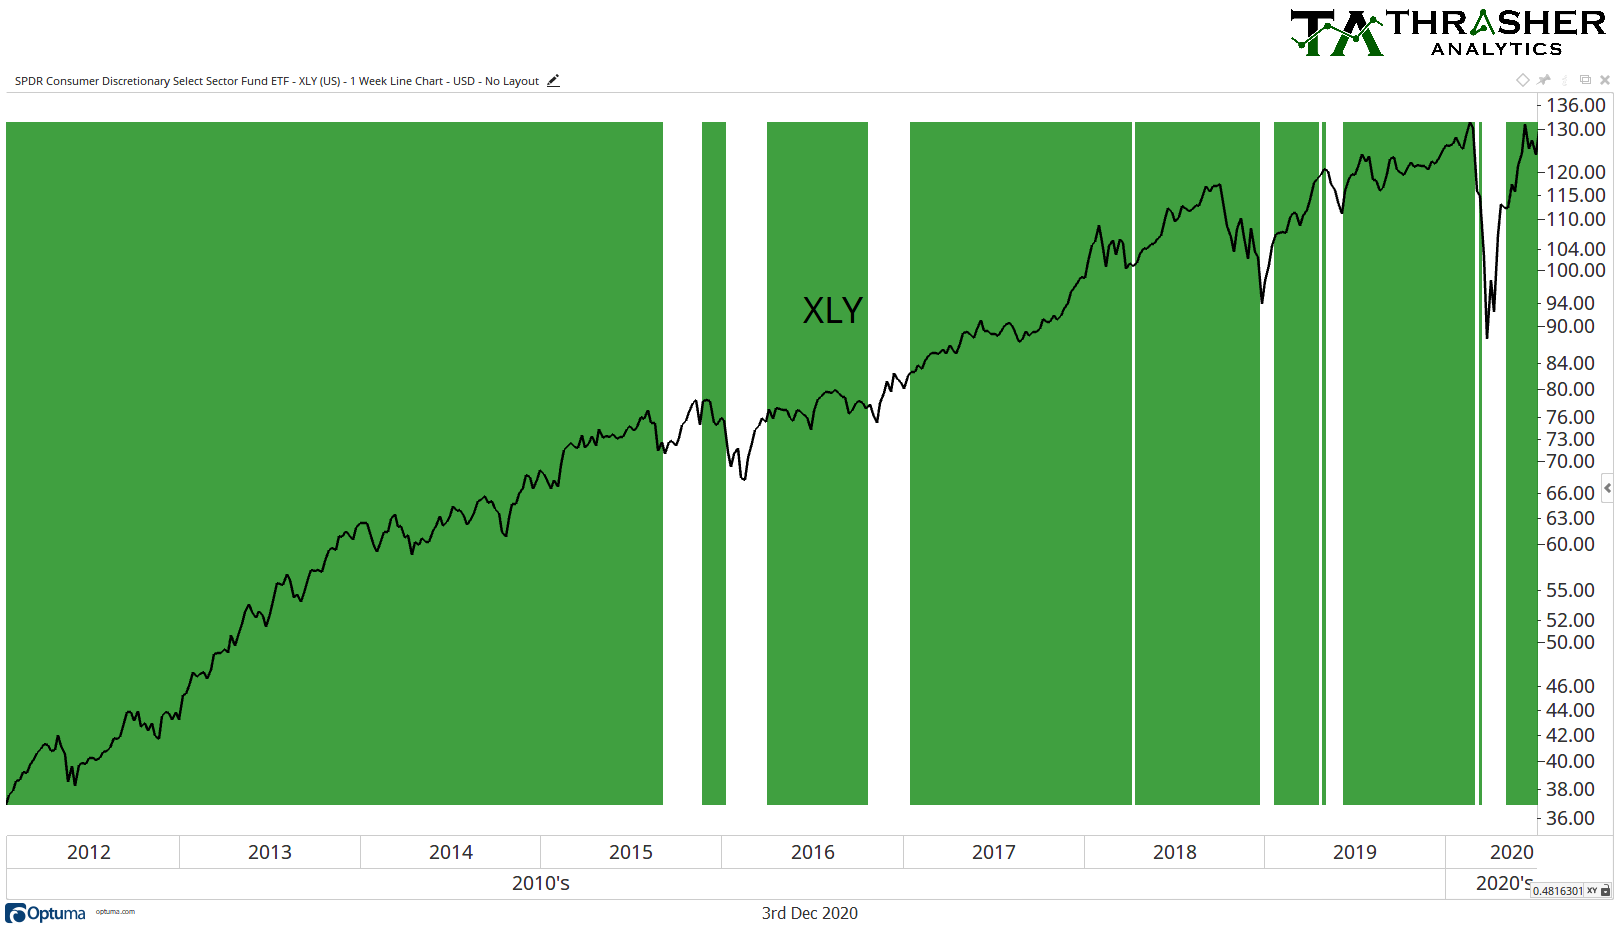
Trend-based analysis is a process built on the idea of enduring minor pullbacks in the anticipating of avoiding protracted drawdowns in financial markets. With a focus on stepping out of the market during large down trends, the Thrasher Analytics Adaptive Trend Model (TAATM) pursues to minimize the “whipsaws” of signals during highly volatile periods of market activity. To accomplish this, TAATM incorporates multiple look-back time periods and incorporates volatility gauges in its evaluation of the equity market’s overall trend.
Thrasher Analytics analysis concludes the market’s trend is led by the resulting trend of its individual stocks. This means, if the majority of stocks are trending in one direction, then the broad index will be persuaded to follow that trend as well. By incorporating the individual stock trends, volatility, and multiple time periods, the TAATM provides a data-focused look at the overall trend of the U.S. equity market.

